How bumpy are the roads in london?
The roads in london are bad. Depending on which borough you’re passing through you could end up with a sore back, or a broken axle. (On Charring Cross road I saw a taxi’s entire wheel get swallowed by a pothole.)

I hear your moaning, but I need evidence.
Indeed, much like my efforts to quantify cloudyness we need sensors, storage, power and maths. We need to know where the bumps occur, and how bumpy the bumps are. (I’m the king of language)
I had some a few serial GPS jobbies lying around from my previous adventures. However they either require some soldering, or a serial to USB converter. As I had a USB-BUBI to hand I used that.
For the processing, I used the raspberrypi. Whilst possible to do this with an arduino, it much, much easier to use something as wildly over powered as the pi. It also has the advantage of having python. This make most task less typey than using C (but at the cost of power and speed.)
To power everything on the move, I used a standard on-the-go mobile charger from amazon. 14ah, with 2A fast charge port. It seemed to be able to power the Pi for about 4-8 hours, which I found impressive.
Finally and possibly most importantly the actual bump sensor: The XloBorg. It has an accelerometer (which measures uppy/downy, lefty/righty and forwardy/backwardy motions in G)
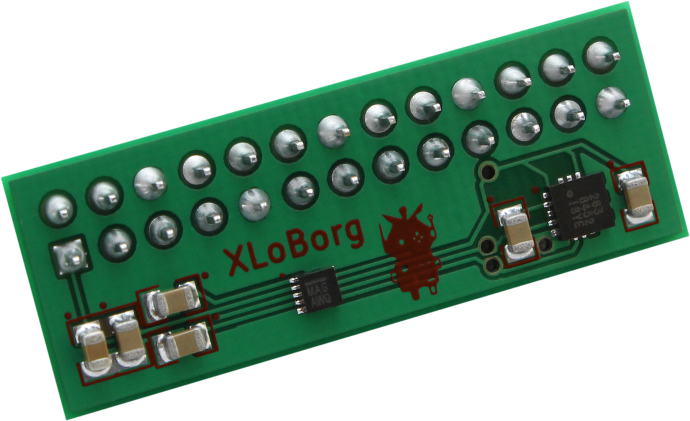
Not only does it have an accelerometer, it has a 3 axis magnetometer which means I can get an absolute direction reading even if its really bumpy. I was so impressed by this feature that I ignored it completely.
So you have hardware, how do you actually store data?
Well dear reader, I’m about to tell you. So the problem facing us that the refresh rate of the accelerometer is much much higher than the GPS. We have to group the samples from the bumpy sensor and tie it to a GPS fix.
A simple approach would be to use a flat text file. The Webdevs amongst you might be thinking along the lines of using JSON. That like most webdev type things is so very wrong on many levels.
The first problem is duplication. becuase there is such a mismatch in update rates between the accelerometer and the GPS, we’ll end up with ten +lines of data for each GPS fix. That soon adds up to a lot of wasted space (or in SDcard land, wasted write-erase cycles)
The second, and more important problem is interrogating the data. If we write our own custom storage system, we also have to write interfaces for things like search, display and curation.
So the logical choice is SQL, SQLite to be specific. (well sqlite3…) This gives us a great interface into many programming languages, and allows us to store data in a structured and mostly un-duplicated way (through the medium of normal form.)
CREATE TABLE journey(id INTEGER NOT NULL PRIMARY KEY, journeyName VARCHAR(100));
CREATE TABLE gpsData (id INTEGER NOT NULL PRIMARY KEY, dateTime VARCHAR(40), lat VARCHAR(10), lon VARCHAR(10), height VARCHAR(10), speed VARCHAR(10), eph VARCHAR(10));
CREATE TABLE bump(id INTEGER NOT NULL PRIMARY KEY, time FLOAT, x CHAR(10), y CHAR(10), z CHAR(10), journeyID INTEGER, fixID);
This SQL creates 3 tables, one to hold all the GPS fixes, one for the bumpyness, and finally one to encase each trip in a nice friendly name.
This allows us to join any number of bumps to one GPS fix, in order. So there is no software limit to the number of samples we can take per GPS fix.
Make with the software man
To make all this run I use python (yes, that noise is the sounds of my dad’s teeth grinding) The basic idea is that we launch two threads, one to look after the GPS, the other to monitor the bouncymeter. We then use a python Queue to feed the information back into the database.
Threads can be scary, however if you use Queues from the very start, a lot of pain can be avoided (also python isn’t actually concurrent, so you don’t tend to have the same problems that you would in C or the like)
To make listening to the GPS simple, I use GPSD This takes the raw NMEA serial output and converts it into a loverly pythonesq data structure. There are a number of helper scripts to make sure the GPS and GPSD are in working order before everything starts.
We use the XloBorg interface glue (enclosed in the git repo with install script) to talk to the accelerometer.
Thread of execution
We start with the function “start()” This is the function that arranges everything in order. First it peels off the database handling function into it’s own thread. This is so that we have somehwere to put the data from the very start.
Next we launch the photo taking thread. Sadly this doesn’t work very well, so doesn’t really do anything.
Then we launch the GPS thread. Because it takes a while to get a fix, and due to the way GPSd works we tend to get funny data for a while, we sit there and wait for the GPS to get a decent fix before doing anything else. Once we are happy that we are should be still running, and that we have a decent fix we launch the bumpyness measurer thread.
Now that we have launched everything we sit back and watch the data stream in.
The full source can be found here: on github
Helper scripts
Because we are using Serial to listen to the GPS we need to set the baud rate correctly. If you look at rc.local (i know, ewww) you’ll see that I use setbaud.pl to tell the GPS what update rate to run at, and which NMEA sentences to kick out. If you have a GPS that remember settings properly, then this will be less of an issue for you.
setup.pl is then run which kills gpsd, sets the serial speed for the usb-serial converter and then tells gpsd to start up with the correct GPS
Sample output:
Here is what the data looks like in the flesh. Sadly I haven’t managed to plot it on a map in any usable sort of way. I’ve been using Geojson, because you know all the trendy web types use it. However it appears I can’t do what I want with it and make mapbox understand. Which is annoying because I can make really sexy looking maps, if only I had the data.
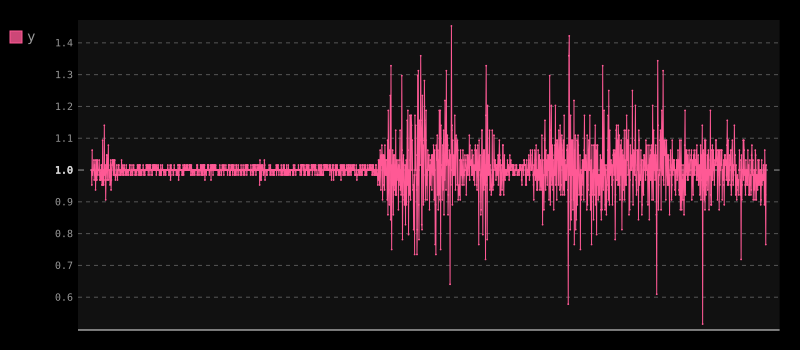 This was originally a super sexy SVG, however it’ll make your browser lag terribly. So I’ve robo-converted it using some dodgy “cloud conversion tool” As you can see I was sitting around at quite a slow speed for a few minutes, then went over some rather bumpy things. The big peak map quite nicely to potholes.