What is it supposed to do?
Wrangle the copious amounts produced by the House Monitor Hardware. Once all the Data has been collected it needs to be cleaned up archived and graphed.
What Software did you use?
- Perl – The main daemon
- PHP – Graphing and webinterface
- Jpgraph – library for graph creation
- SQLite – for storing the data
- Crond – for triggering database cleaning and archiving
Block diagram

Sample graph outputs
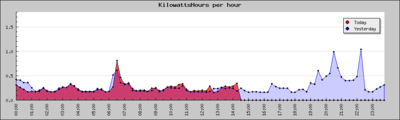 Here is a sample power graph. You’ll note that the scale is in kilowatt hours and not kilowatts. The power meter provided by Electricity company only tells me when 1/1000th of a kilowatt(a “blip”) hour has been consumed. To get a nice pretty graph, the day is split into 15 minute chunks. All the blips that occurred in that 15 minute chunk are then added up together.
As you can see there is a rather large base load of around 200 watts. about 50 watts can be traced to the boiler constantly pumping water round the radiators. The small mounds that occur every 3 hours or so are the fridge and freezer.
The spike at half six is the girlfriend getting up and going to work. We both come home around about 7pm-ish and start cooking and watching telly.
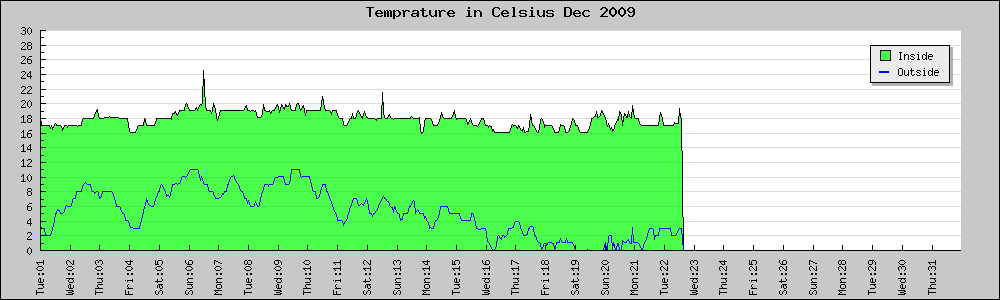
![]() Here is an almost complete year of temperature.
Here is an almost complete year of temperature.
Stay tuned for source code!
1 reply on “Arduino House Monitor – Software”
Hi!
So where’s the source code ?